Article, map, and graphics by Rich McEldowney
The primary source of hydrology at the Indreland Audubon Wetland Preserve is shallow groundwater contributions from the south and southeast. Preliminary investigations suggest that the groundwater expressed on the site originates from two sources—the East Gallatin River alluvial aquifer, and from the Gallatin Range, flowing under the Bozeman Fluviatile until it is intercepted by the East Gallatin River in this part of the valley (Hackett et al. 1960).
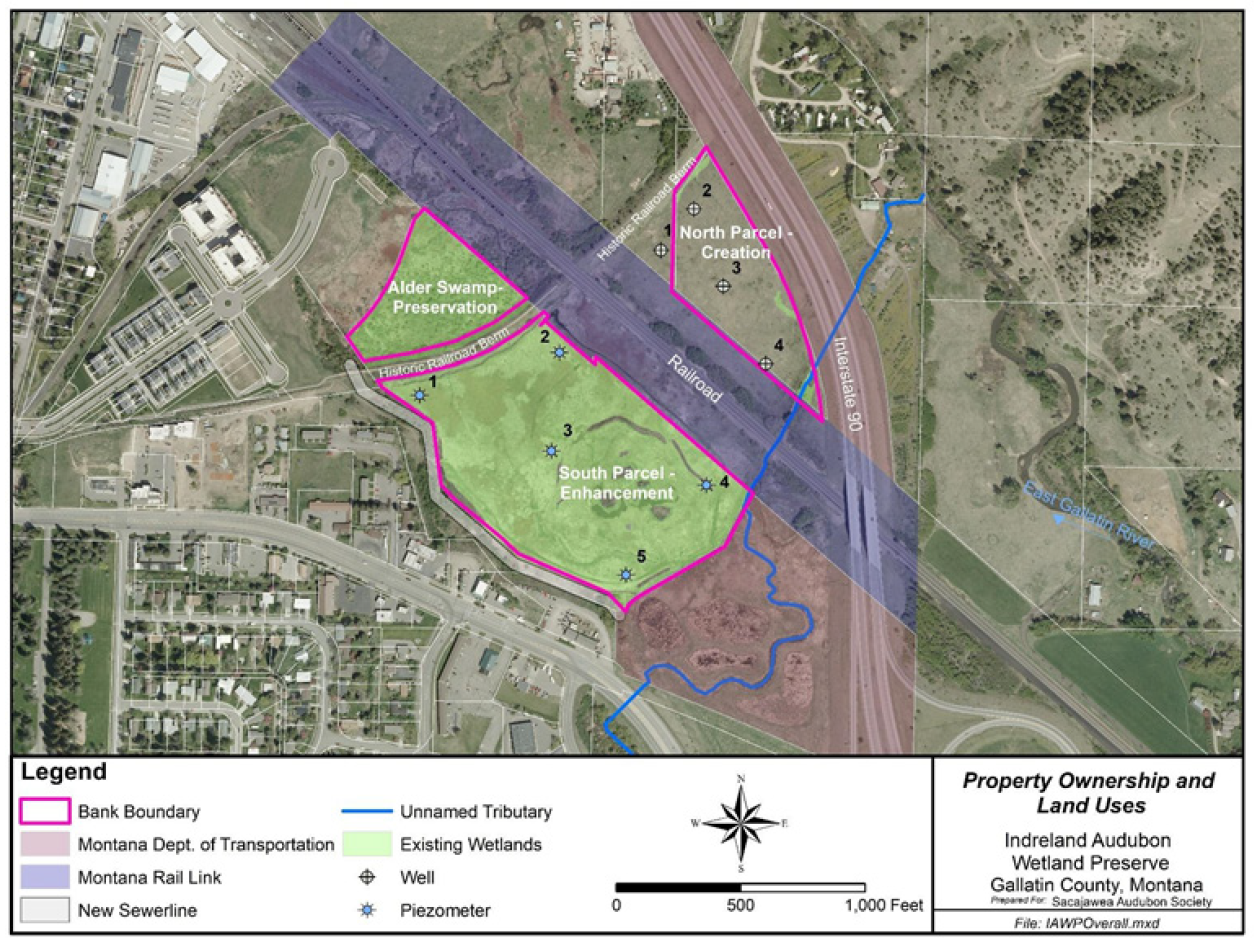
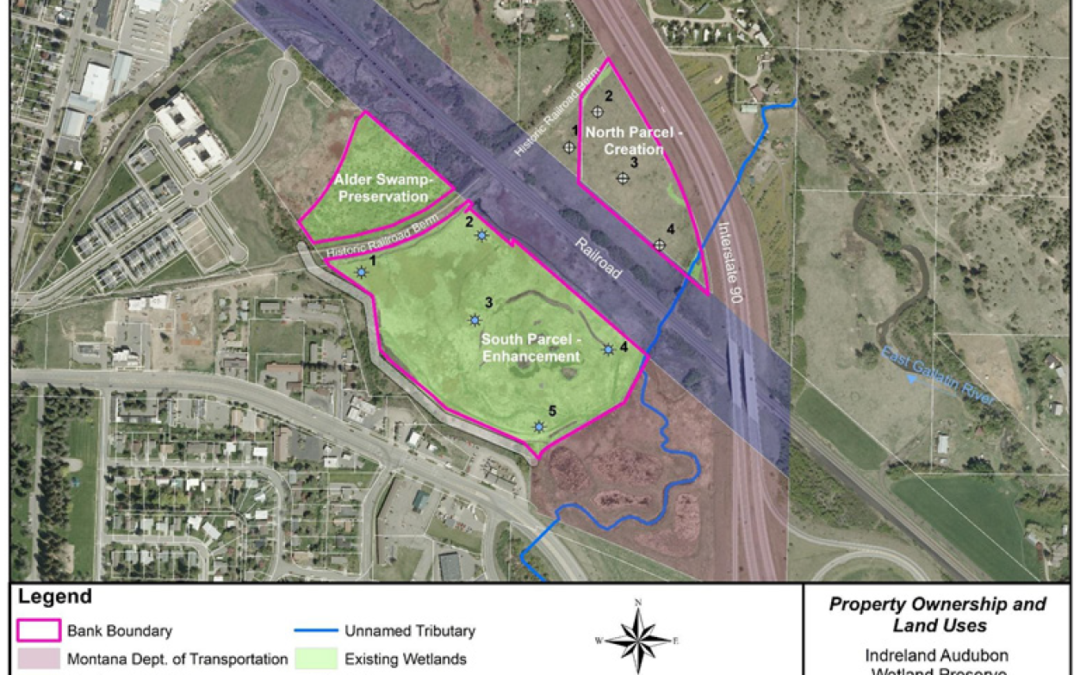
To better assess the site’s hydrologic conditions, groundwater elevations were measured in 2020 and 2021 at groundwater wells on the north parcel and in 2021 with piezometer devices on the south parcel (Figure 6, Appendix A). Data was collected at five piezometer devices between April and October 2021, and four groundwater wells between May 2020 and October 2021. Piezometers were installed on the south parcel instead of groundwater wells in order to better understand artesian pressures of the system, groundwater hydraulic gradients, and the aquifer’s ability to fill and maintain pond levels at design pool elevations through the growing season.
Depth to groundwater over the monitoring period for the north parcel is shown on Figure 2. Groundwater levels for the north parcel were generally highest in May and early June in 2020 and 2021, ranging from 5 to 32 inches below ground surface (Figure 2, on page 4) and declined throughout the summer and fall months.
Figure 2. 2020 and 2021 groundwater levels, measured at four groundwater wells within the IAWP north parcel.1
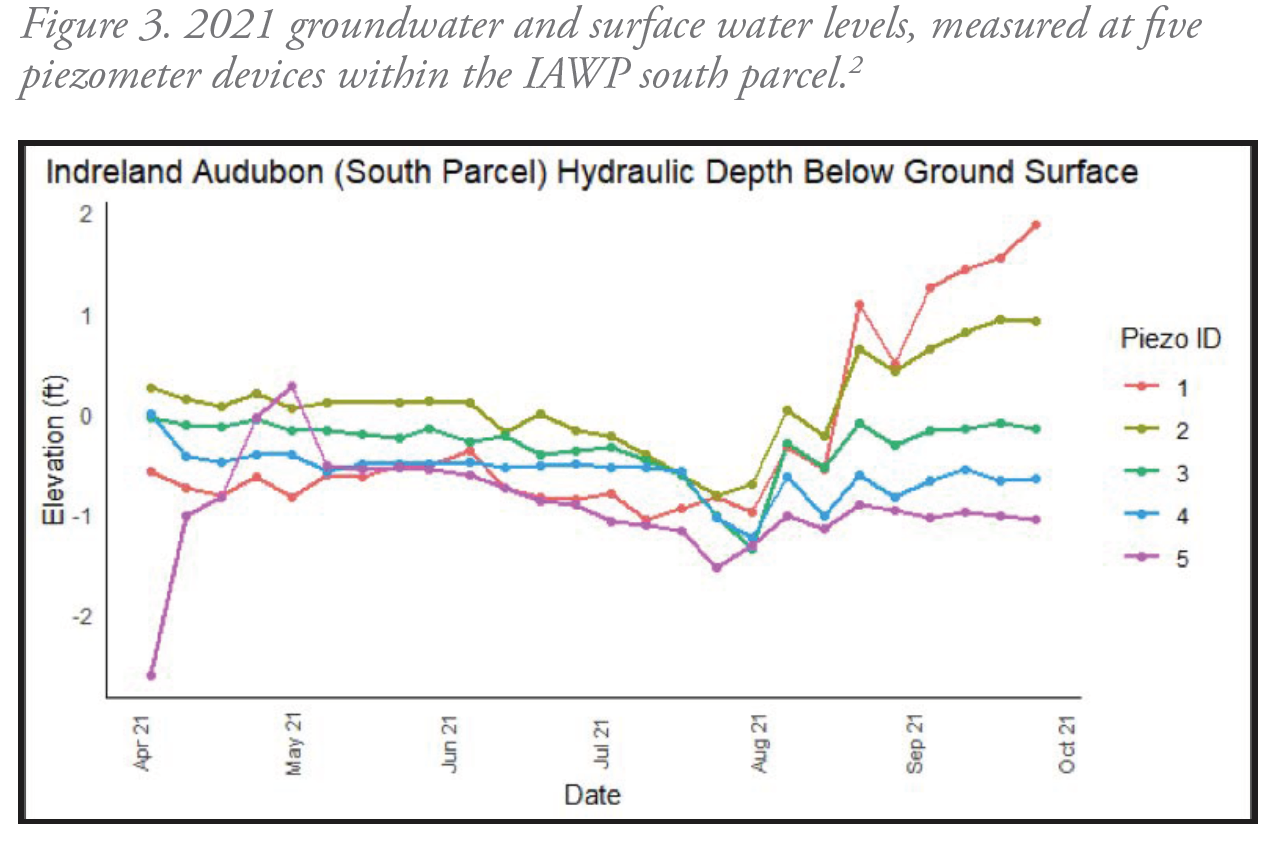
Figure 3 shows the piezometer monitoring results for the south parcel. In this parcel, water levels were relatively constant for all piezometers for the early part of the summer, and then dipped at the end of July/beginning of August. Water levels in piezometers 1 and 2 were much higher in late August through October 2021, ranging from 12 inches below to 21 inches above the ground surface. This increase is directly related to the occurrence of beaver on the site and their blocking of the outlet culvert. Water levels in piezometer 3 also increased slightly, and was also likely influenced by the beaver activity. Piezometers 4 and 5 occur further from the outlet culvert and appear to have recovered to their early summer levels once irrigation pumping stopped at the end of August/beginning of September.
Figure 3. 2021 groundwater and surface water levels, measured at five piezometer devices within the IAWP south parcel.2
Footnotes
<1> Wells were not continuously monitored. Lines connecting the dots are included to help show general trends in the groundwater data and are not intended to imply actual depths to groundwater.
<2> Piezometer devices were not continuously monitored. Lines connecting the dots are included to help show general trends in the groundwater/surface water data and are not intended to imply actual depths to groundwater.
Rich McEldowney is with Confluence Consulting, Inc., which is partnering with SAS to design the restoration and enhancement of the Indreland Audubon Wetland Preserve.